
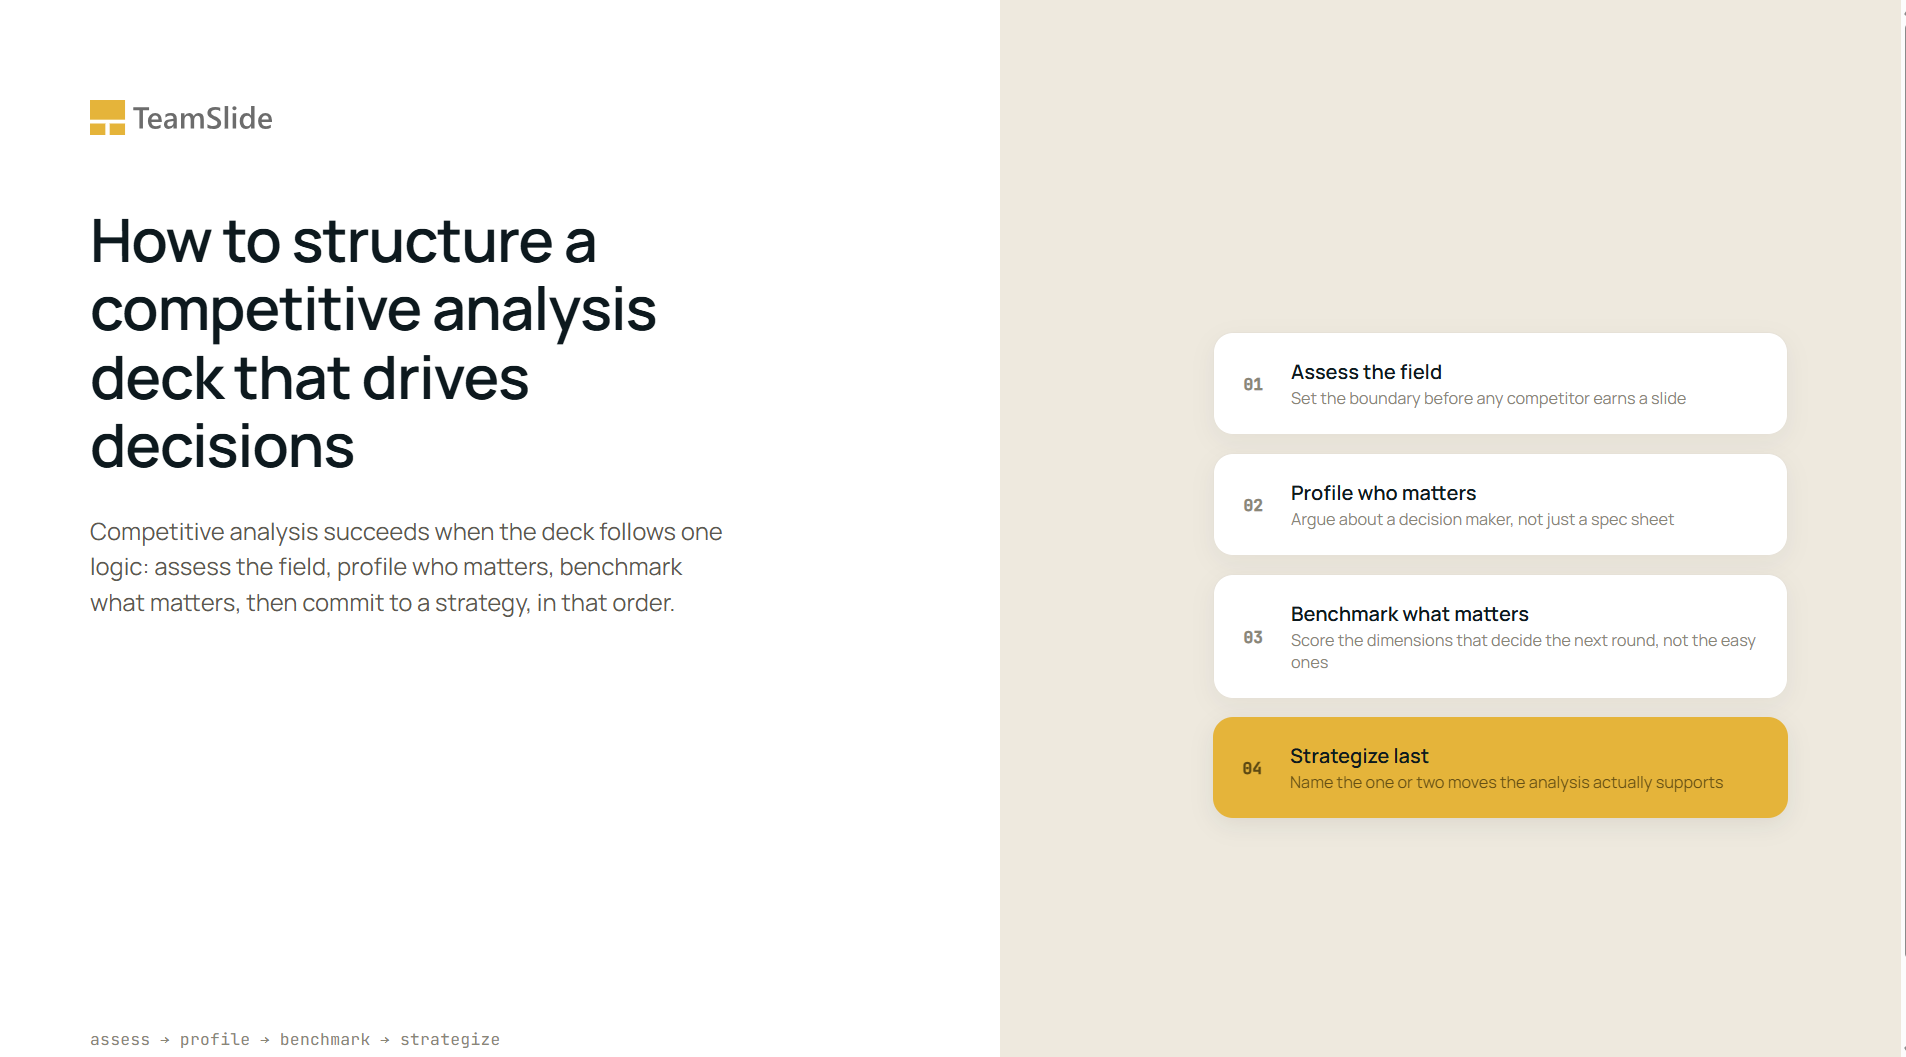

Most people assume a weak competitive analysis is a research problem: too few sources, a stale spreadsheet, an intelligence function that stopped checking six months ago. The real failure is almost always structural: a forty-slide deck profiles five competitors in exhaustive, identical detail and never tells the reader which one actually threatens the plan, because nobody sequenced the work. Assess the field before profiling a single rival, benchmark only the competitors that matter, and strategize last, not first. Skip that order and even excellent research reads like an appendix in search of a thesis.
Scope: The field gets defined before any competitor gets a slide
Before any competitor earns a slide, the analysis needs a boundary. That boundary comes from two decisions most teams skip past: what question this analysis is actually answering, and how far “competition” extends. A project defending market share and a project sizing a new-market entry pull from different competitor lists, different time horizons, and different levels of geographic depth, so naming the question first keeps the research from ballooning into a survey of the entire industry.
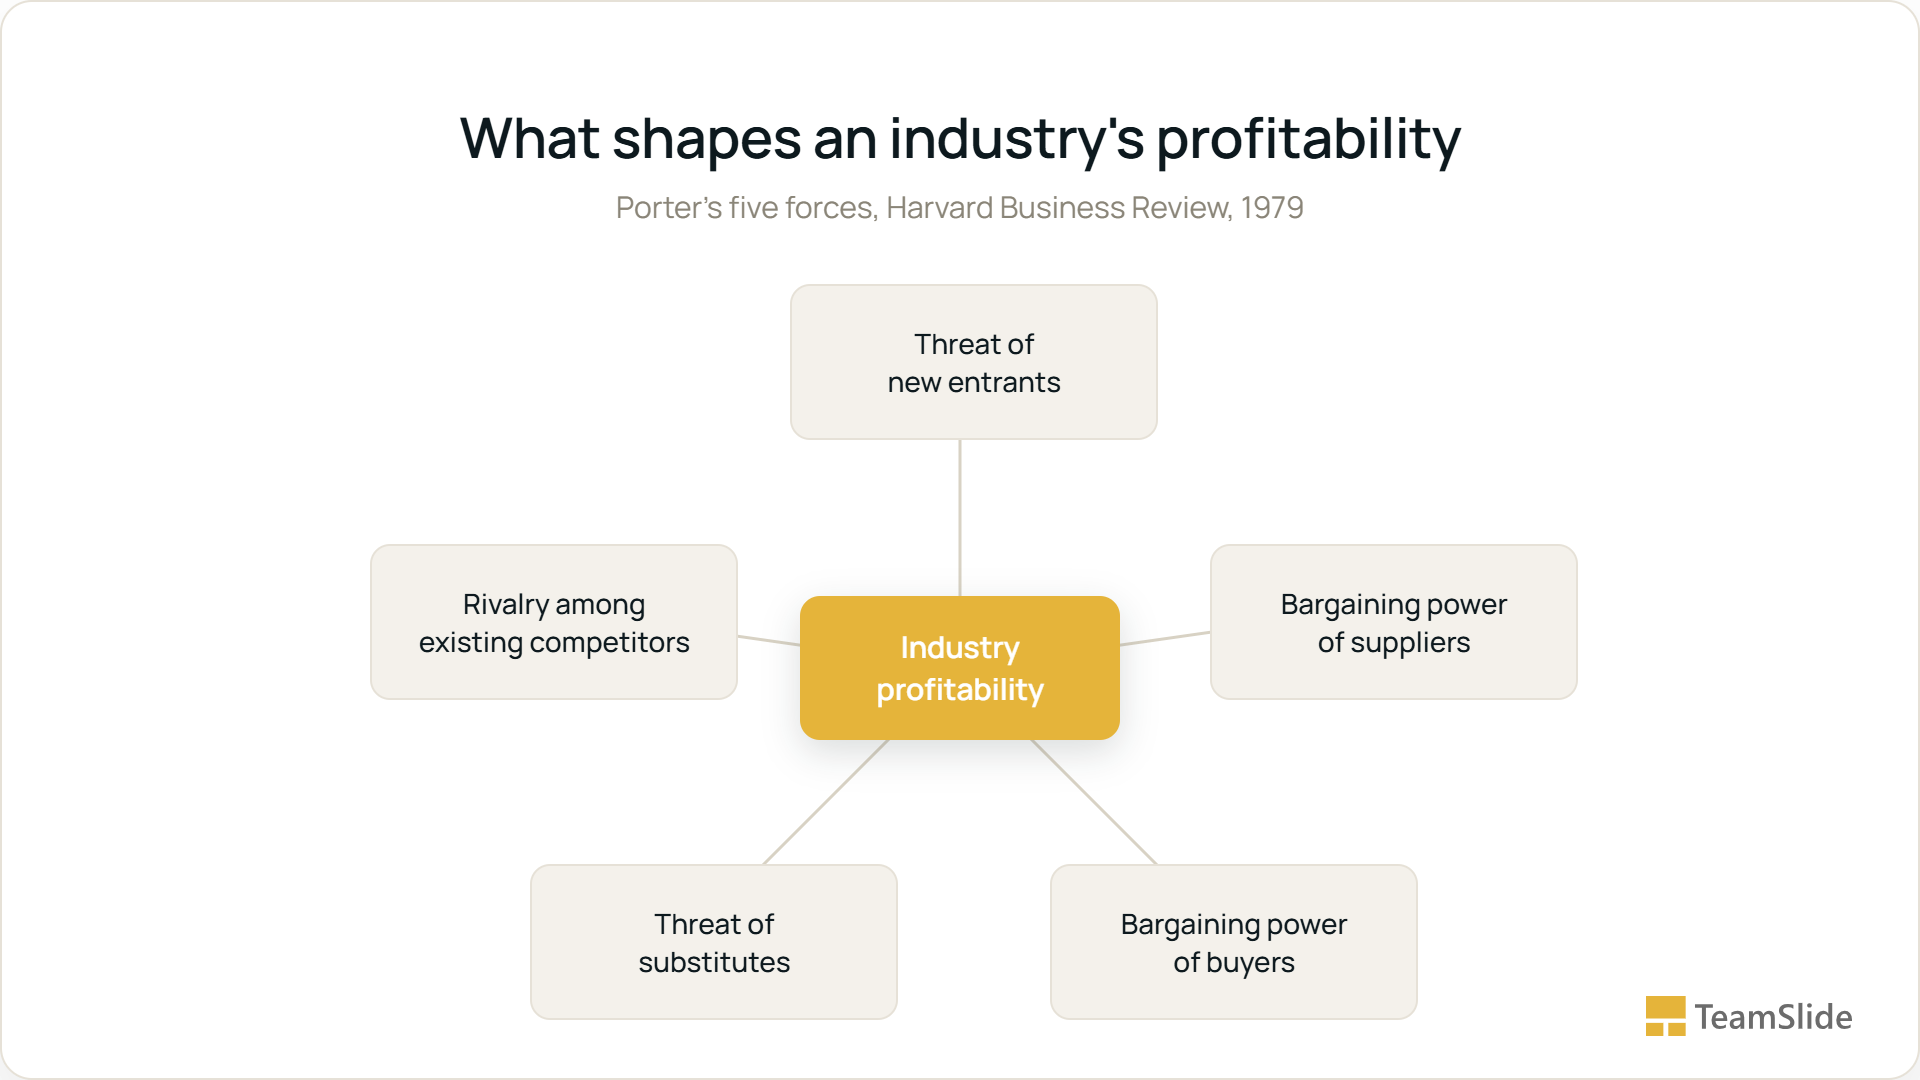
The second decision, how far competition extends, is where Michael Porter's five forces still earns its place nearly five decades after Harvard Business Review first published it. Porter's argument was that an industry's profitability is shaped by more than the rivals selling a similar product. The bargaining power of suppliers and buyers, the threat of new entrants, and the threat of substitute products all press on it too. Applied to a competitive analysis, the framework works as a scoping tool as much as an analytical one: it forces the question of whether the real threat to a category is a direct competitor at all, or a substitute product, a newly credible entrant, or a supplier gaining leverage. A deck that profiles five direct rivals but never asks whether the category itself is being substituted has scoped the analysis too narrowly to be useful.
A competitor profile argues about a decision maker, not a spec sheet
Once the field is scoped, the temptation is to build one profile slide per competitor: revenue, headcount, product lines, pricing, done. That produces an inventory, not an argument. McKinsey's Hugh Courtney, John Horn, and Jayanti Kar draw a sharper distinction in their research on predicting competitor behavior: companies that resemble each other in assets and market position tend toward symmetric competition, reacting to the same pressure in similar ways, while companies with different endowments compete asymmetrically, reacting to identical pressure in opposite directions.
Their fast-food example makes it concrete. When the obesity backlash hit the category, McDonald's, the category leader with the most exposure to public scrutiny, rolled out foods it promoted as healthier. Burger King, a smaller player with less to lose, leaned into high-fat, high-calorie products and unapologetic advertising instead, deliberately cherry-picking the less health-conscious segment McDonald's could no longer chase. Two companies facing an identical market shift moved in opposite directions, because their starting positions differed.
The same authors trace an equivalent logic through the console rivalry between Sony, Microsoft, and Nintendo. Each company's move followed from what it already owned, not from a generic read of “the market”: Sony protected its content and disc-format licensing business, Microsoft defended its software franchise, and Nintendo chose a cheaper, game-first design over a living-room hub strategy.
A profile slide that captures a rival's assets and incentives, not just its current metrics, can predict roughly where that rival moves next. For genuinely uncertain situations, the same research recommends war games. Assign a team to think and decide as each competitor would, then run several rounds. Treat a team's surprising decisions as the actual insight: a real competitor is likely to do the same.
Build that distinction into the slide, not just the talking track: one side lists what the competitor already owns, its assets, market position, prior bets, and the other names the move that ownership makes likely. A profile with a predicted-move line at the bottom has made an argument. A profile with only revenue, headcount, and product lines has just relocated the inventory one slide earlier.
Benchmark the dimensions that will matter next, not the ones already easy to score
The benchmarking stage usually defaults to whatever is easiest to put in a table: price, features, market share. Those numbers matter, but BCG's Ryoji Kimura, Martin Reeves, and Kevin Whitaker argue that durable competitive advantage increasingly sits on dimensions a classic benchmarking table skips entirely.
Netflix's recommendation engine is their clearest example. The platform pulls in behavioral data, generates personalized suggestions, and keeps users watching longer. That, in turn, feeds more data back into the system to sharpen the next recommendation, a loop the authors call a data flywheel that a features-and-pricing comparison would never surface.
Alibaba's advantage is structural in the same way. Rather than performing most functions itself, it orchestrates a network of manufacturers, logistics providers, and marketers. The authors credit that design with 44 percent annualized revenue growth over the prior five years, growth a line-item comparison against a single rival would miss completely.
Bain's NPS Prism benchmarking service applies the same instinct to customer experience specifically. It breaks one loyalty score into the layers that actually explain it: relationship-level NPS against named competitors, episode-level scores for individual moments like checkout or onboarding, channel performance in person versus online, and share of wallet, how much of a customer's spending in the category still goes elsewhere.
The lesson holds across both examples: pick the two or three dimensions likely to decide the next round of competition in this specific category, not the ones that happen to already sit in a spreadsheet. Then build the benchmarking slides around those.
The slide order should carry the same logic as the analysis
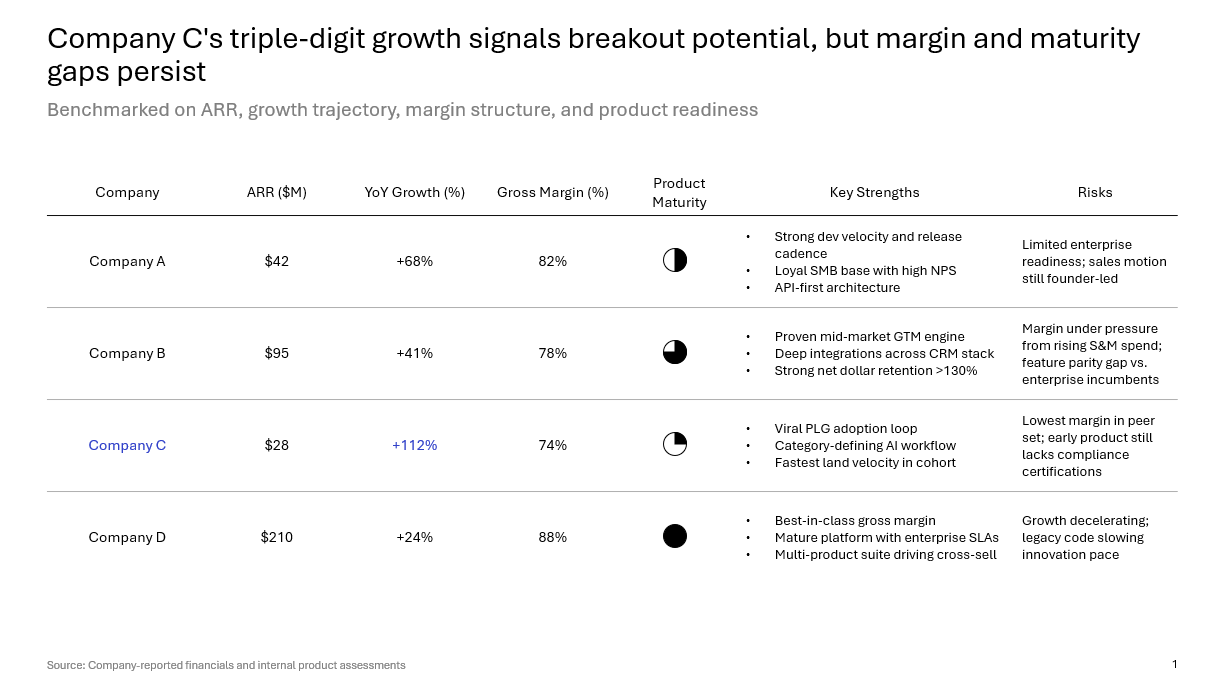
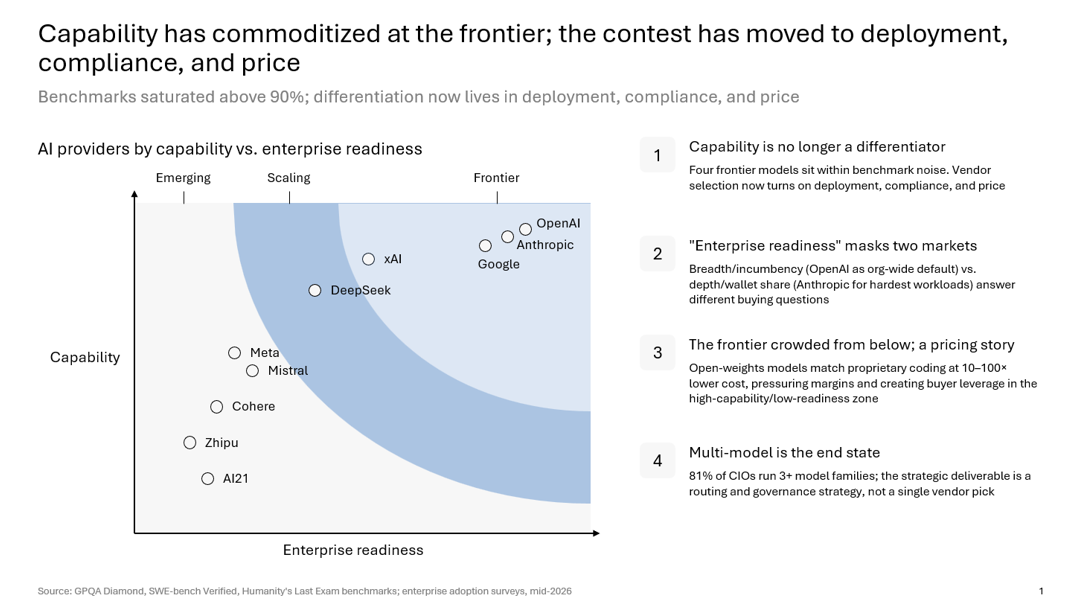
None of the above matters if the deck presents it out of order. The industry-forces view belongs before the individual profiles: a reader who doesn't yet know the boundary of competition has no way to judge whether five profiles are the right five. The profiles belong before the benchmarking table, because a benchmarking score means little without knowing what kind of competitor is being scored.
The strategy section belongs last, and it should read as a decision rather than a menu: the one or two moves the analysis actually supports, not every option the research happened to surface along the way. A deck that lists four possible responses with no ranking is not being careful. It is avoiding the one thing the reader came for.
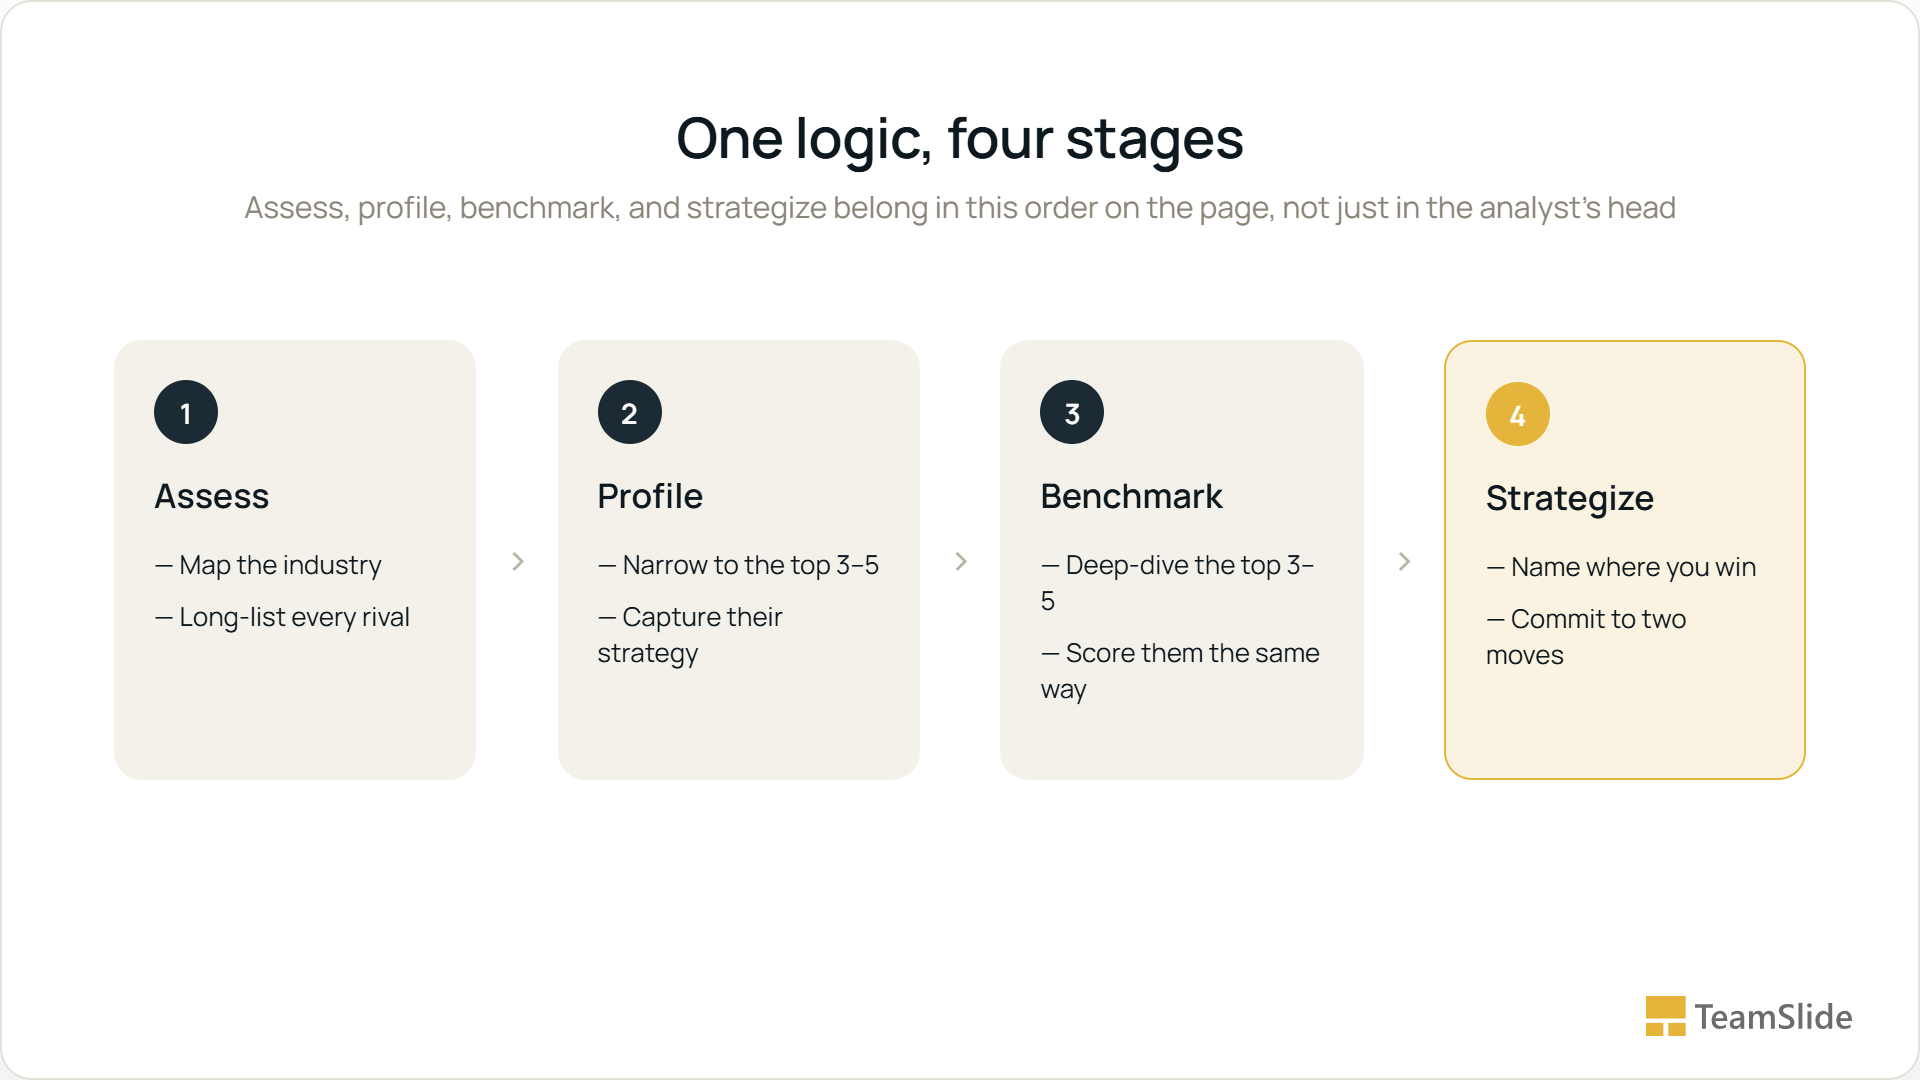
The same discipline should shape how much space each stage gets. A scoping section that runs six slides deep on market sizing has probably wandered into a different analysis. A profiles section that gives a tier-three niche player the same depth as the market leader has stopped prioritizing. The stage that deserves the most real estate is almost always the last one, because it's the only stage the reader actually needs a strong opinion on.
Pre-Read Checklist- COMPETITIVE ANALYSIS DECK
Does the last slide name a choice, not summarize a list of options?
Would two people leaving the room name the same top competitor?
Does at least one slide compare the leader's actual weakness to your actual strength?
Is any profile built to a depth nobody in the room asked for?
Does the industry-forces view appear before the individual profiles, not after?
Go back to that forty-slide deck from the opening: the failure was never the five competitor profiles inside it, each one was probably accurate. The failure was equal weight, equal depth, and a closing slide that read like a list. The deck that treats every competitor with identical care has quietly declined to have an opinion, and research that never earns an opinion was never going to change what happens in the room.
Each stage needs its own slide type, not one repeated one
This piece has argued that the failure is structural as much as it is research: a competitive analysis deck moves through four different jobs, scoping, profiling, benchmarking, and recommending, and each one calls for a different slide type. Rebuilding those formats by hand is exactly the kind of work that crowds out the judgment the deck actually needs. TeamSlide turns rough notes for each stage into a structured, on-brand slide in seconds, so the time an analyst saves on formatting goes straight back into the thinking this piece has been arguing for.
→ Turn your competitor notes into slides
FAQs
What is a competitive analysis framework?
A competitive analysis framework is a structured sequence for evaluating rivals: assessing the industry and competitive field, profiling the competitors that matter, benchmarking them on the dimensions that will decide the next round, then translating findings into strategic choices. The order matters as much as the content, since profiling competitors before scoping the field usually produces an unfocused list rather than a usable recommendation.
How many competitors should a competitive analysis cover?
Most competitive analyses benefit from profiling three to five competitors in real depth, even when the initial long-list runs much longer. Tiering competitors, direct rivals warranting deep profiles, niche or emerging players getting a lighter mention, keeps the deck focused on the comparisons that actually change a decision.
What is the difference between a competitive analysis and a SWOT analysis?
A competitive analysis is the research process that gathers facts about the industry and specific rivals, while a SWOT analysis is one way to synthesize that research into strengths, weaknesses, opportunities, and threats relative to competitors. SWOT typically sits inside a competitive analysis as a synthesis step rather than replacing it.
Should a competitive analysis include indirect competitors and substitutes?
Yes, whenever a substitute or indirect competitor could plausibly take share from the category rather than just from one product line. Porter's five forces treats the threat of substitutes as a distinct force shaping an industry's profitability, separate from direct rivalry, which is why scoping the field should ask about substitution before the profile list gets built.
How often should a competitive analysis be refreshed?
The right cadence depends on how fast the category moves. Fast-moving markets with frequent launches or pricing changes often warrant a quarterly refresh, while slower, capital-intensive industries can hold to an annual or biannual cycle. Treating the analysis as a one-time deliverable is a more common mistake than picking the wrong interval.
What benchmarking dimensions matter beyond price and features?
Depending on the category, useful dimensions can include customer experience at the level of individual journey moments, data or ecosystem advantages that compound over time, talent and operational capability, and share of wallet within existing customers. The right dimensions are the ones likely to decide the next round of competition in that specific category, not the ones already sitting in a spreadsheet.
What should the last slide of a competitive analysis deck say?
The last slide should state a specific recommendation rather than summarize the options considered. A strong closing slide names the one or two moves the analysis actually supports and explains why those moves beat the alternatives, instead of listing every strategic response the research happened to surface.
Is desk research enough, or does a competitive analysis need primary research too?
Desk research, annual reports, pricing pages, press coverage, can establish a solid baseline, but primary research such as customer interviews, win-loss conversations with a sales team, or a dedicated benchmarking service tends to reveal the reasoning behind a competitor's moves that public sources rarely state outright. How much primary research makes sense depends on what is riding on the analysis and how opaque the competitor already is in public sources.